Jira Reporting · Runs on Forge
Cross-Project Reports for Jira
One report across every project you run — filter, group, chart and export in clicks. No JQL required, and your data never leaves Jira.
- Data stays in your Jira (Atlassian Forge)
- Read-only Jira scopes
- Developer support, ≤ 2 business days
Last updated June 13, 2026
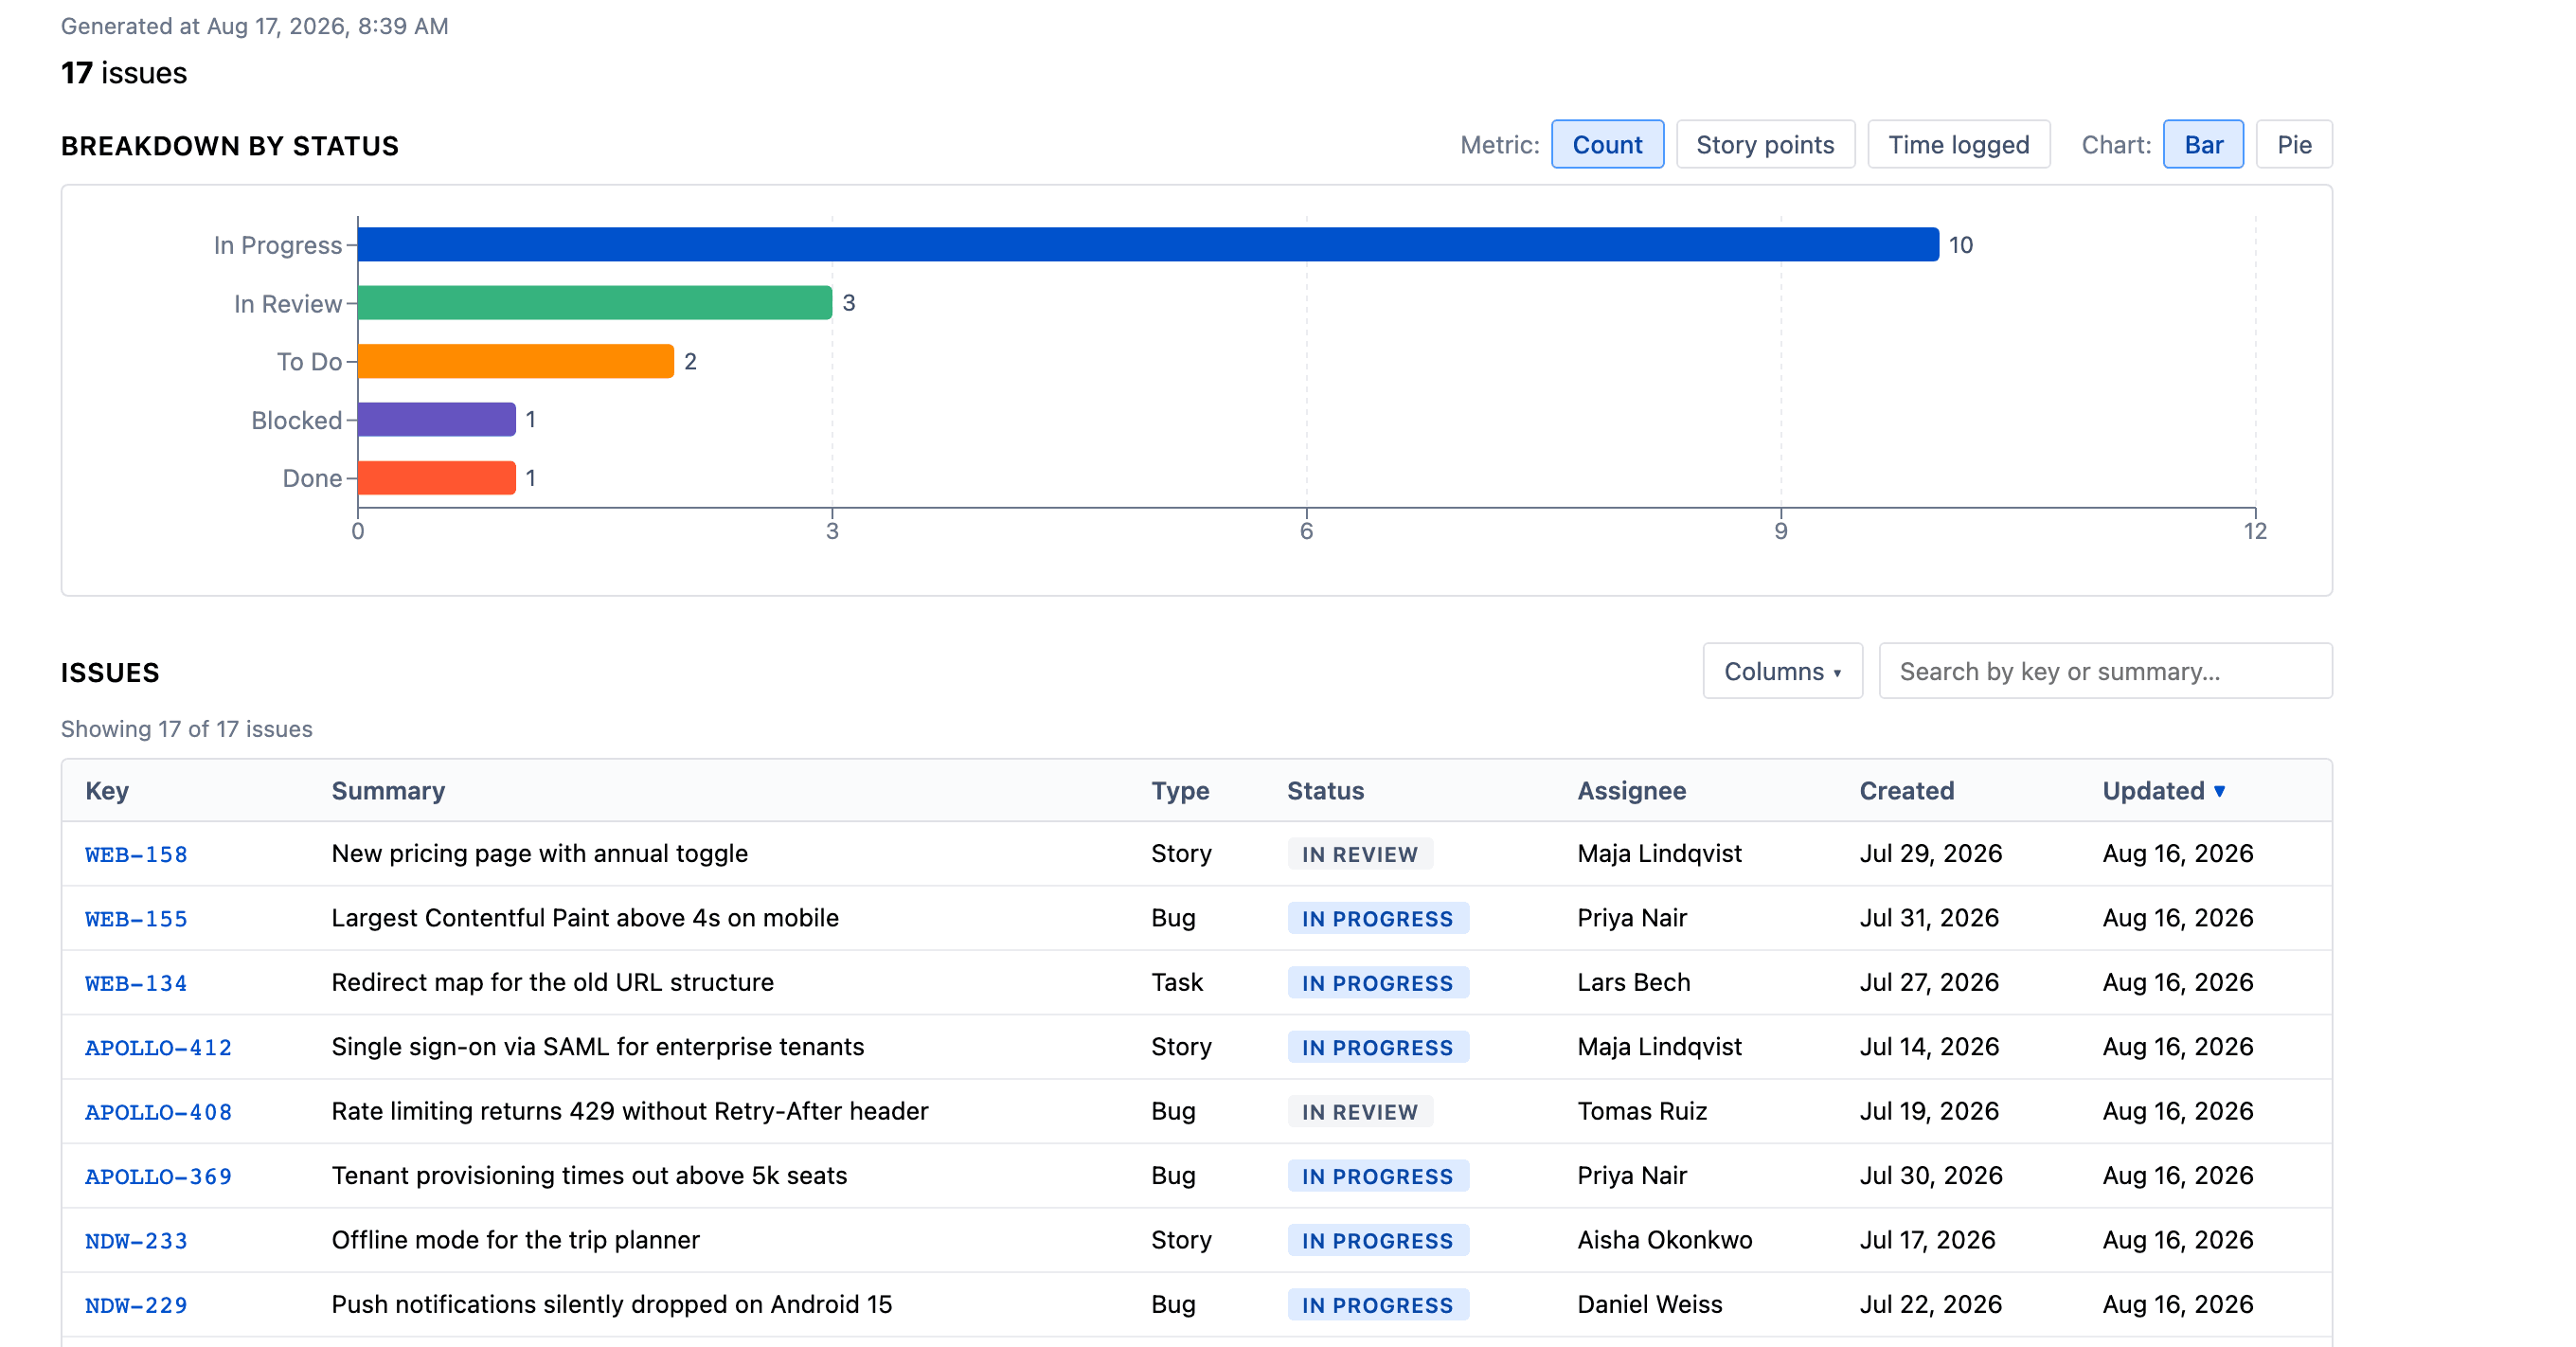
What it does
Multi-project picker
No-JQL filters
Group & chart
Drill-down
Story points or count
Saved reports & CSV
Quick start
- Install the app from the Atlassian Marketplace (you need permission to install apps).
- In Jira, open Apps → Cross-Project Reports.
- Pick two or more projects. The picker only shows projects you have Browse projects permission on.
- (Optional) Open Filters to narrow by date, type, status, label, sprint, assignee, or reporter.
- Choose a Group by dimension, then click Run report — the chart and issue table render together.
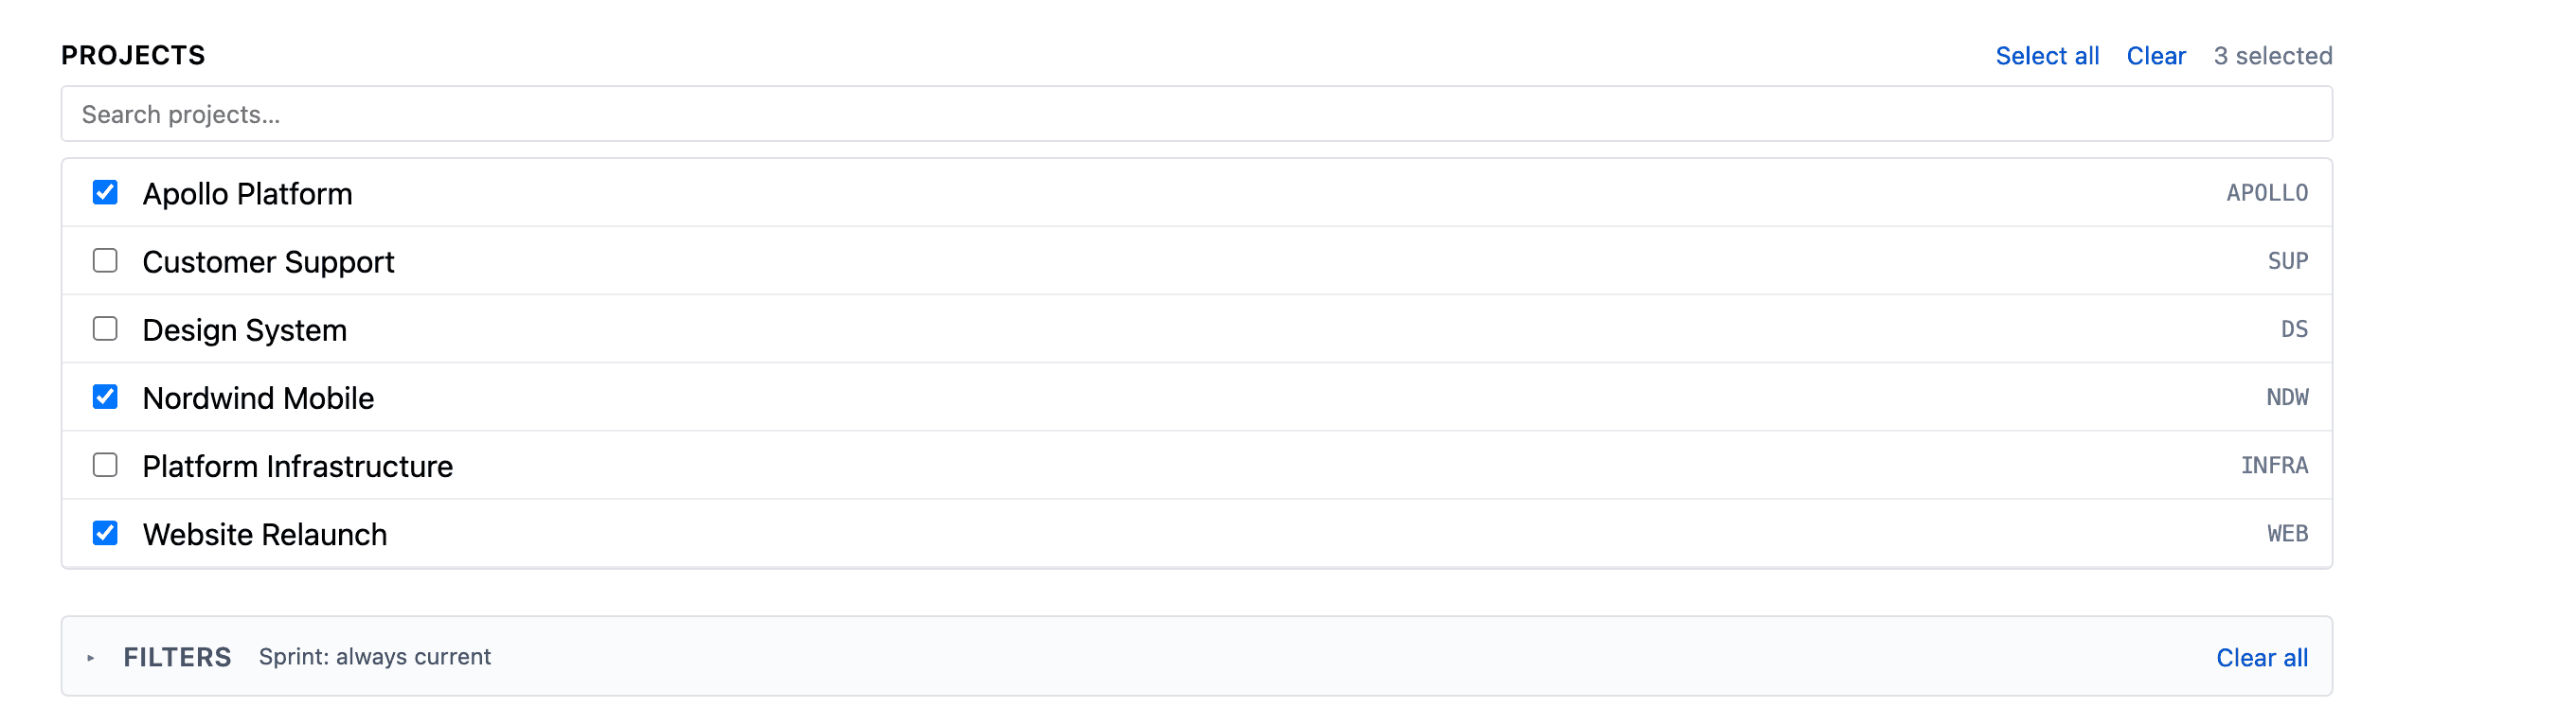
The project picker
The picker lists every project your account can read. Search by name or key; Select all picks everything currently visible, Clear resets it. This is the only place the report’s scope is set — the report never widens beyond what you picked.
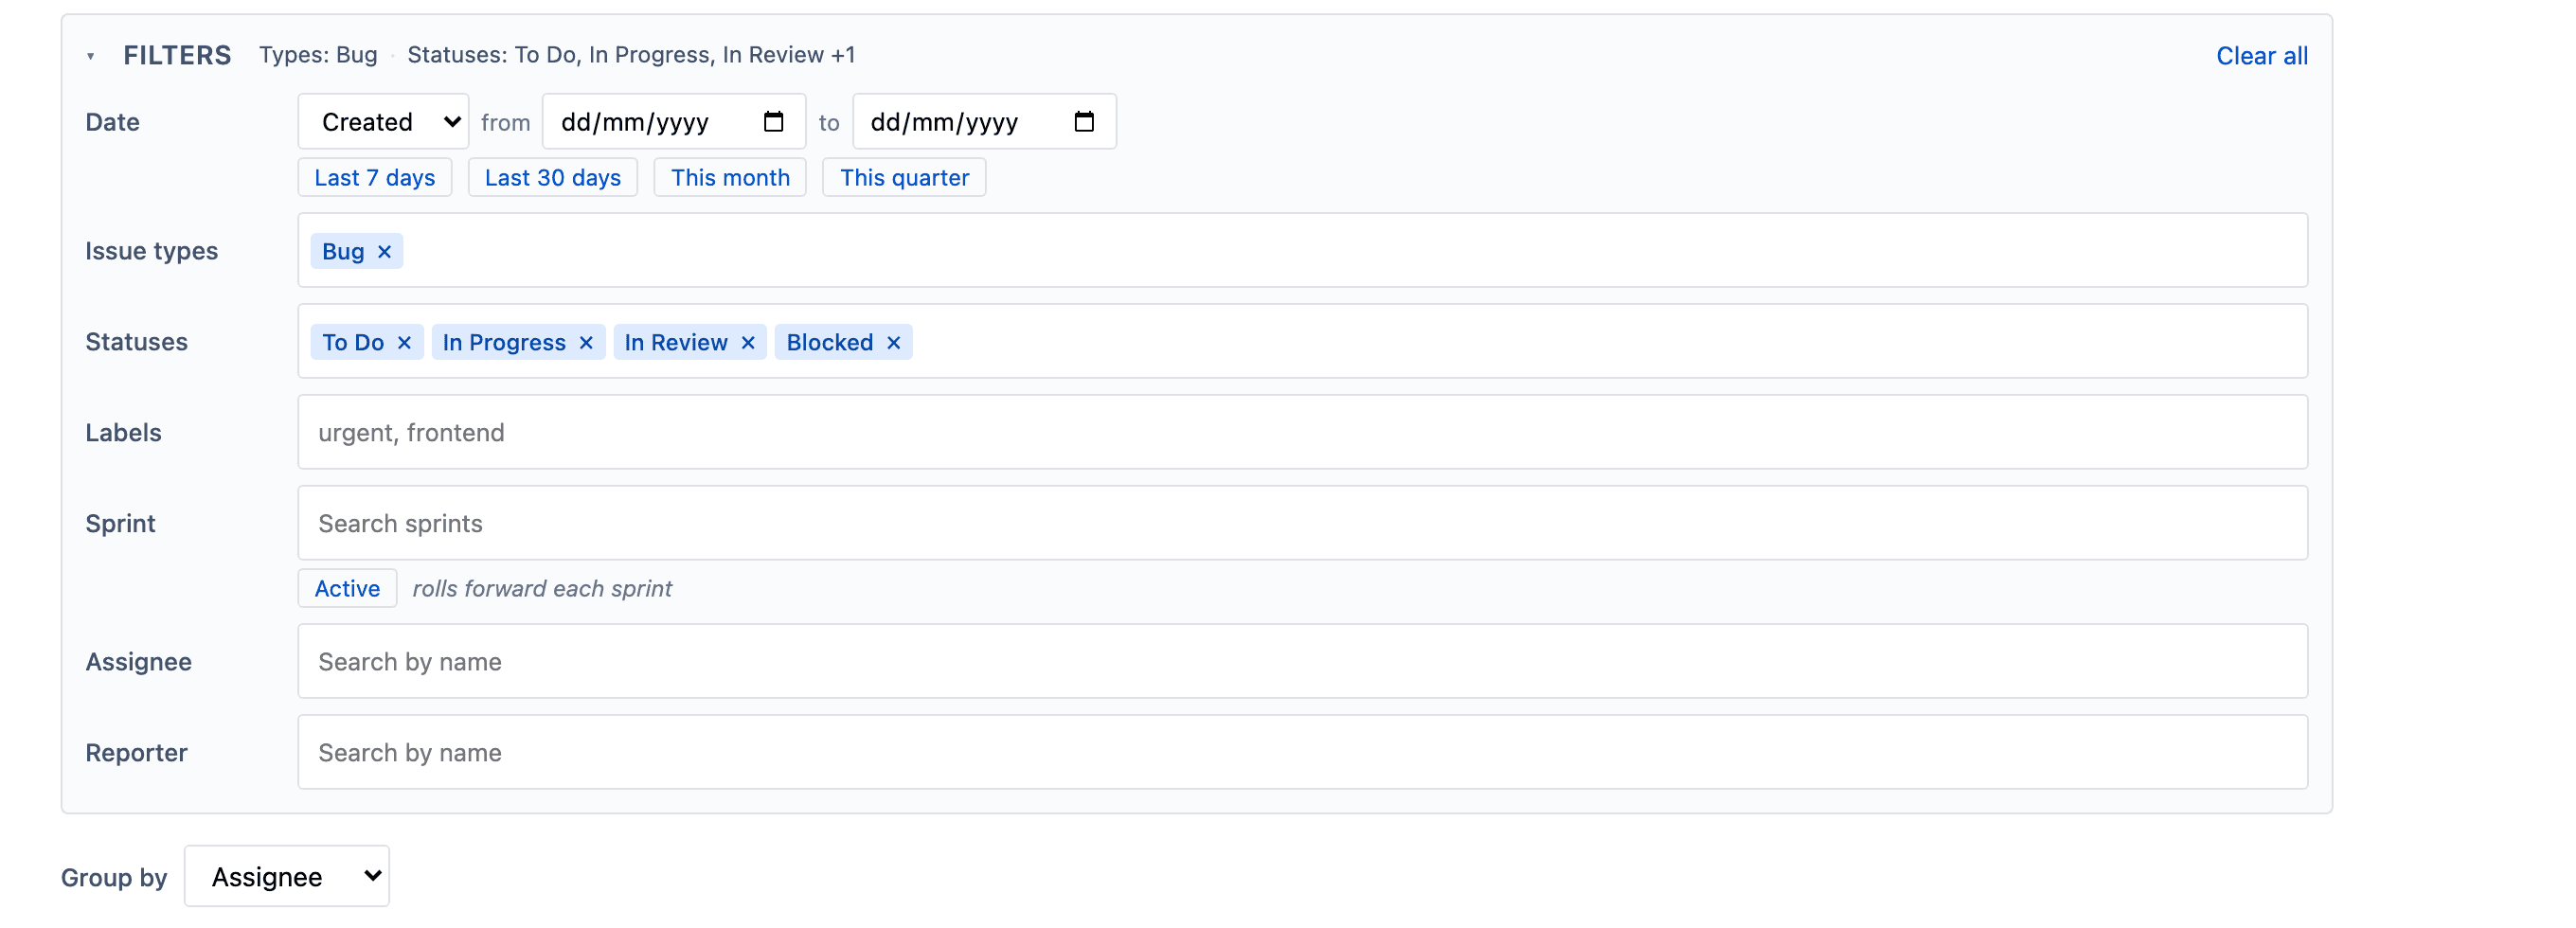
Filters
The Filters panel is collapsed by default and shows a one-line summary of what’s applied. Expand it to edit; use Clear all to reset. Every filter is optional.
- Date — pick a field (Created, Updated, Resolved) and a custom range or preset (Last 7 / 30 days, This month, This quarter).
- Issue types, statuses, labels — comma-separated, matched case-sensitive on the Jira side.
- Assignee, reporter — typeahead user search; resolves display names for you.
- Sprint — typeahead over Scrum-board sprints in the selected projects, active and historical.
Rolling “Active” sprint preset
Grouping & charts
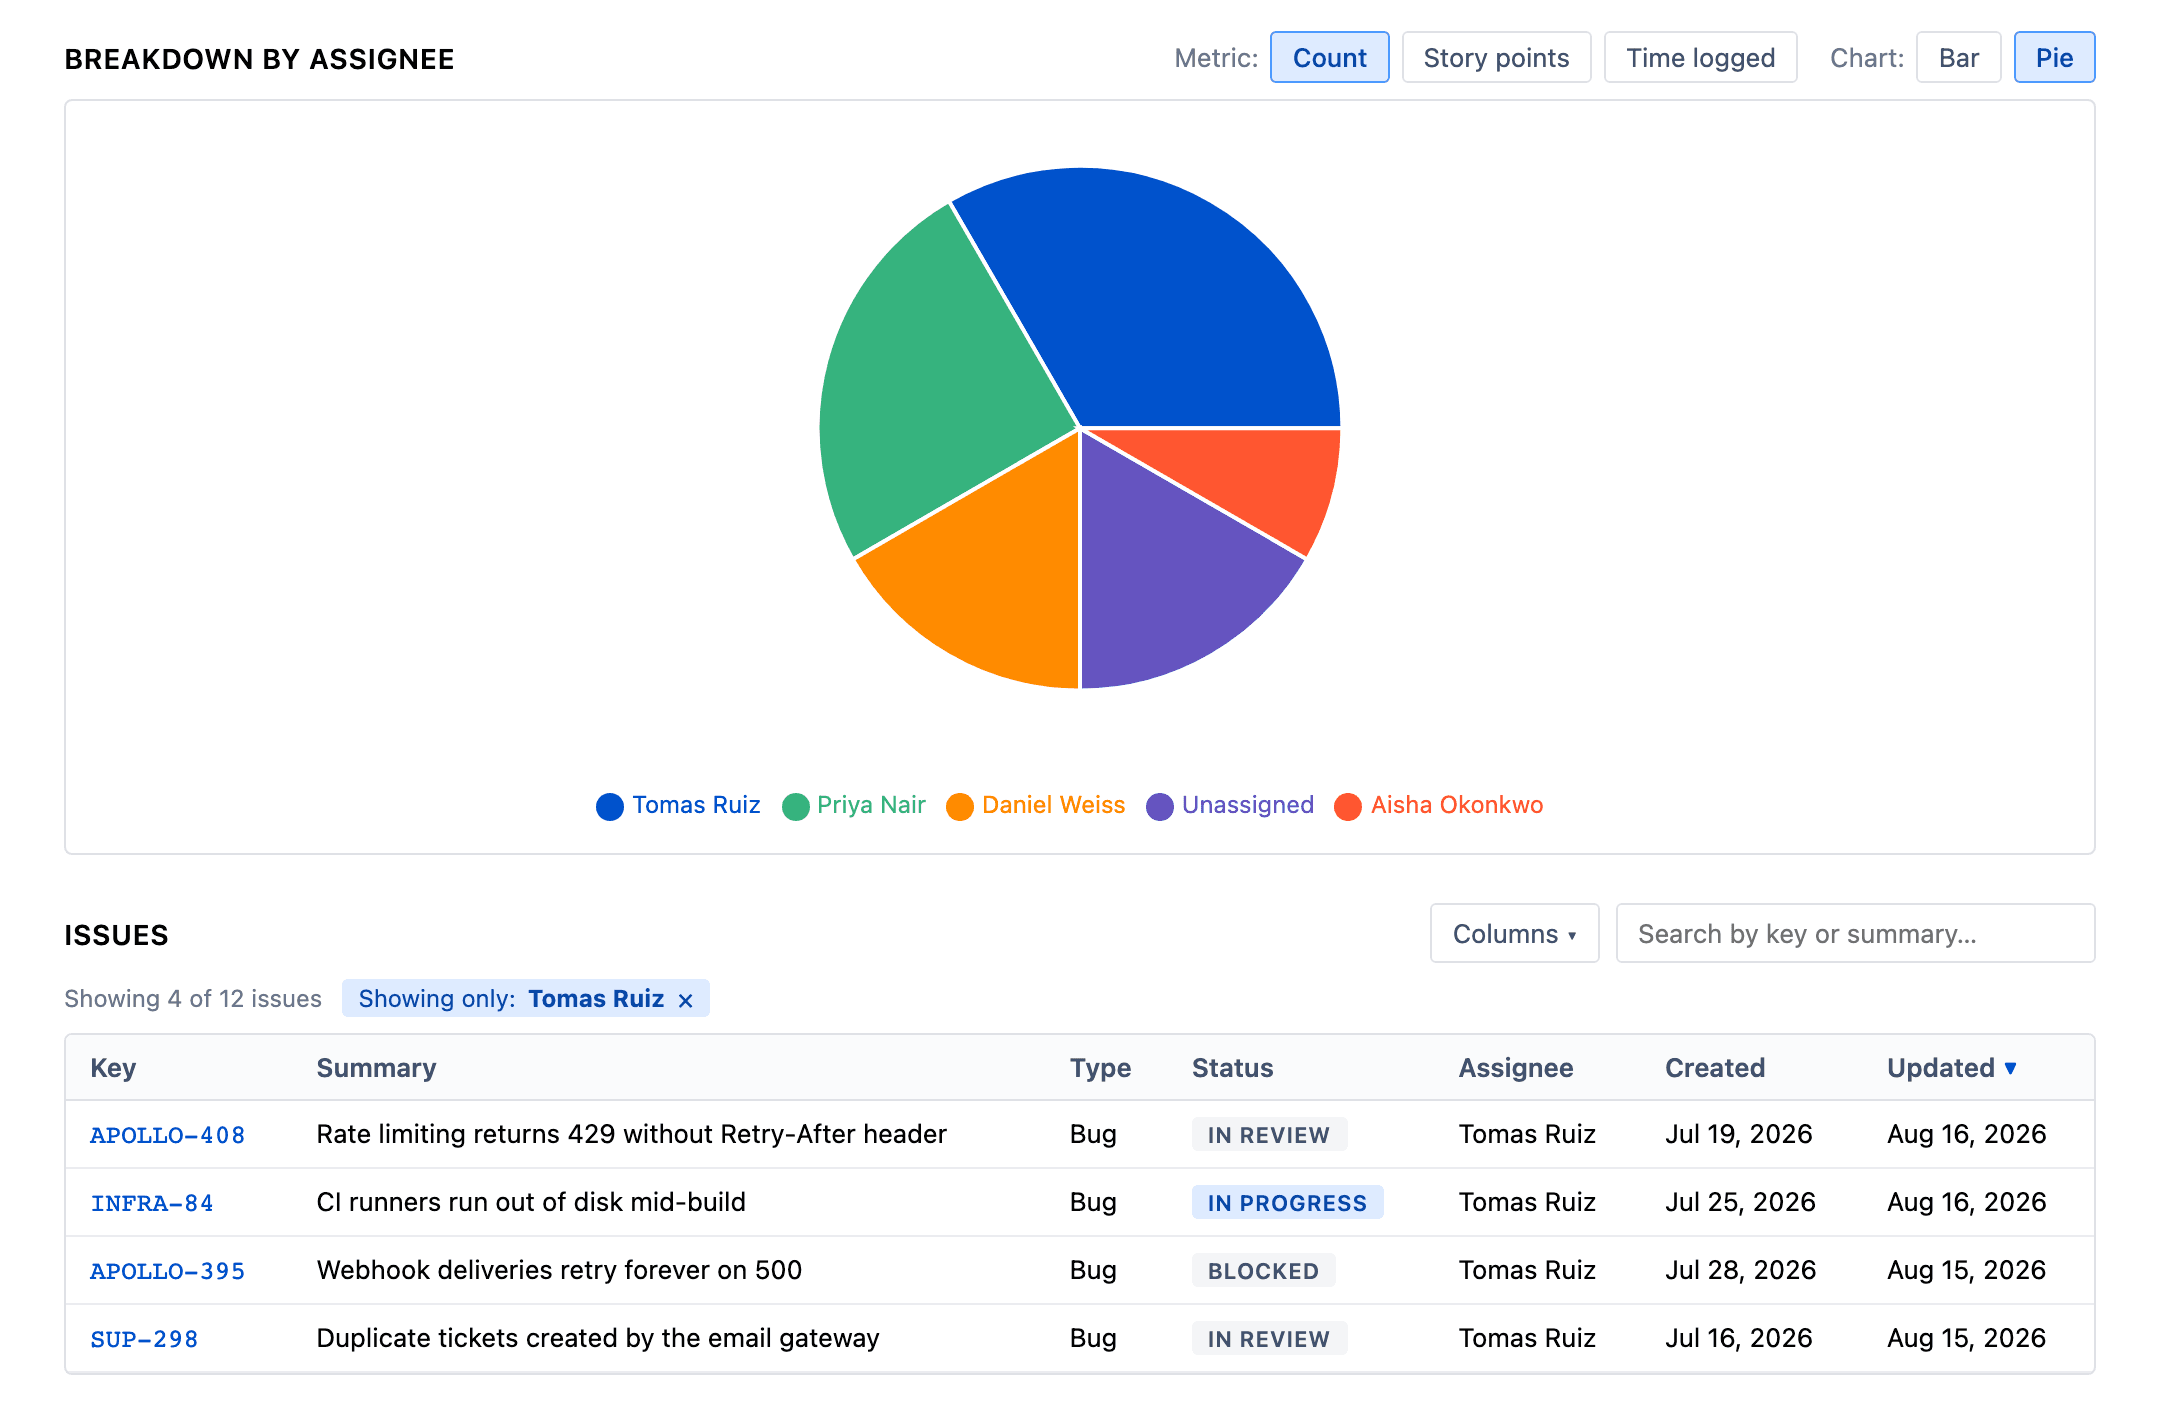
Group by buckets issues by Status, Assignee, Issue type, Priority, Project, or Sprint. Switch Bar / Pie with the chart toggle, and flip the Metric between issue count and summed story points (issues without an estimate are excluded, with a footnote showing how many).
Drill-down: click any bar or slice to filter the issue table to that bucket. A chip above the table shows the active drill-down — clear it to return to the full list.
The issue table
- Sort any column by clicking its header; the Age column sorts so the oldest issues rise to the top.
- Search matches issue keys and summaries.
- Show/hide columns from the Columns popover — your selection is saved with the report.
- Paginate at 100 issues per page.
Saved reports & CSV export
Click Save, name the report, and it appears as a chip at the top. Loading it restores everything — projects, filters, grouping, chart type, metric, and columns. Saved reports are per-user: only you can see, load, or delete your own, and they live in Atlassian’s Forge Storage scoped to your account.
Export CSV produces a full dump of the report’s issues (ignoring the on-screen search and drill-down). It’s RFC 4180 compliant and wraps issue keys as text so spreadsheets don’t mangle keys like SCR-7.
Limits & permissions
- A run returns up to 5,000 issues (most-recently-updated first); a notice appears if your filter matches more.
- Every call uses your own permissions (Forge’s
asUser), so the app never returns data you couldn’t already see. It requests read-only Jira scopes plus app storage — no write access, no data egress.
Full details are in the Privacy Policy.
FAQ
Why doesn’t my project show up in the picker?
The Sprint filter is empty for my project.
Story-point sums look off.
My saved report says the configuration is stale.
Does it work in Jira Service Management?
Can I share a saved report with my team?
On the roadmap
We keep v1 focused. Not included yet, but on the radar:
- Cycle-time and time-in-status analytics
- Worklog rollups
- Dashboard gadgets
- Scheduled email reports
- Sharing saved reports between users
- Jira Service Management compatibility
Ready to try it?
Install it from the Atlassian Marketplace. File bugs and feature requests on GitHub Issues, ask in Discussions, or email piotr@midgaard.software. We reply within two business days.